 Tennessee was the first state to systematically gather and disseminate district and school-level value-added data in 1995. It was and is the most statistically sophisticated methodology in use. The Education Consumers Foundation was the first to compile Tennessee’s TVAAS scores into online, interactive and printable graphics that allow users to see schools statewide ranked on the basis of their effectiveness in lifting student achievement.
Since that time, numerous states and school districts have adopted what is essentially the same value-added assessment system as Tennessee. These include statewide implementations in Ohio, Pennsylvania, and North Carolina. While empirical proof would be difficult to obtain, Tennessee schools appear to have benefited from expanded public access to and awareness of value-added data. It currently leads the nation in improved student achievement according to the National Assessment of Educational Progress.
The ECF School Performance Charts
“And, even in a sea of discussions and forums on education, parents are often hungry for one piece of information above all else: data that helps them select a school for their children.”
– Katherine Boehret, Wall Street Journal
“Grading Neighborhood Schools,” February 20, 2008
The Tennessee Department of Education has given the public access to the school-level results of the Tennessee Value-Added Assessment System (TVAAS), which indicates how effective a school is at helping its students learn. However, it is not easy to understand the raw numbers provided by the state, and it is almost impossible to compare the performance of schools and districts across the state. The Education Consumers Foundation has solved this challenge by creating its School Performance Charts, allowing the public to easily compare the performance of schools and districts in Tennessee through an intuitive and easy-to-use chart.
- 2014 elementary
- 2014 middle
- 2013 elementary
- 2013 middle
- 2012 elementary
- 2012 middle
- 2011 elementary
- 2011 middle
- 2010 elementary
- 2010 middle
- 2009 elementary
- 2009 middle
- 2008 elementary
- 2008 middle
- 2007 elementary
- 2007 middle
- 2006 elementary
- 2006 middle
- 2005 elementary
- 2005 middle
Note: these charts reflect a three-year average of data from previous Tennessee Report Cards.
Note that the 2011 and 2012 charts for elementary and middle grades calculate rankings differently than in the past. Previously, rankings were based on actual TVAAS scores in reading and math; now, ECF calculates a grade point average using the grades assigned by the state to reading, math, science and social studies. Reading and math grades are double-weighted to reflect their primary importance in learning, and the schools’ average reading and math scores are used as a secondary indicator in determining rankings.
These charts represent only those schools that have published value-added scores on the Tennessee Department of Education report card. If your school is not found here, it is likely because no data is available on their value-added performance; check the report card to confirm.
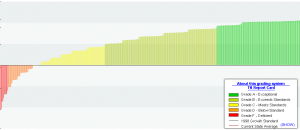
The average amount of achievement gain made by Tennessee students in 2009 is the benchmark or standard against which school effectiveness is currently judged. That standard, also called the Tennessee “Growth Standard,” is denoted by the horizontal line that runs across the middle of our charts.
For the 2009 charts and beyond, value-added performance grades are significantly lower than those of previous years. The reason, according to the Tennessee Report Card page on Grading Scales:
The 2009 baseline provides a fixed transition point prior to the 2009-10 school year implementations of the new curriculum standards and assessments more reflective of national and international student performance in the 21st Century. The 2009 achievement scores and all grades connected with these scores are considered the new baseline for future public reporting. These converted achievement scores and grades are based on restructured calculations and a redefined grade scale that are updated to reflect the current status of educational attainment in the state. The 2009 change has prohibited comparisons to previous years’ data for achievement reporting including state, district, and school-level scores and grades. For 2009 only, the most appropriate and meaningful comparsion would be to State level data.
Extensive information about each school may be accessed through the Tennessee Department of Education’s website. You can also review Frequently Asked Questions about the charts, or go to the Value-Added Achievement Awards home page for more information.
The School Performance Charts show which schools are best as seen on a level playing field. The Growth Standard line crossing the chart represents average annual growth in student achievement in 1998. The bars that deflect downward from the Growth Standard line represent schools that are failing to meet the expected minimum. Bars that deflect upward represent schools that are exceeding the minimum standard. The gap between the 1998 Growth Standard and the current state average reflects the progress in annual student achievement gains made by Tennessee schools since 1998. Follow the instructions at the bottom of the chart to highlight individual schools and school systems.