Ohio: Comparing schools and districts based on student proficiency
The information below reflects the most recent data available to us; please contact us with questions or to request additional analyses.
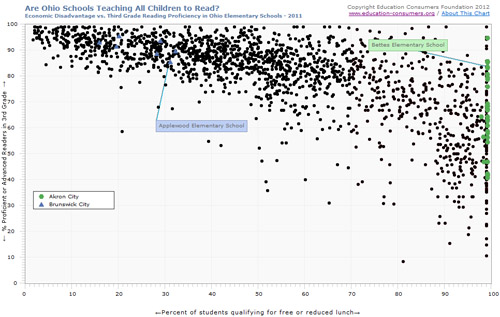
Analysis: Comparing schools and districts on third grade proficiency in reading and math
The charts linked below allow you to compare schools and districts in Ohio with their peers. The Y (vertical) axis shows the percentage of proficient 3rd graders in a subject; the X (horizontal) axis shows the percentage of students who qualify for the free or reduced rate lunch program, a common indicator of poverty in schools.
Available charts:
- Poverty versus 3rd grade reading proficiency rates (2023)
- Poverty versus 3rd grade reading proficiency rates (2019)
- Poverty versus 3rd grade reading proficiency rates (2018)
- Poverty versus 3rd grade reading proficiency rates (2017)
- Poverty versus 3rd grade reading proficiency rates (2016)
- Poverty versus 3rd grade reading proficiency rates (2014)
- Poverty versus 3rd grade reading proficiency rates (2013)
- Poverty versus 3rd grade reading proficiency rates (2011)
USER ALERT: For purposes of counting the number of students who are eligible for programs covered by the National Free Lunch Act, the Cleveland, Akron and Youngstown school districts has been permitted by the USDA to declare 100% of their students to be economically disadvantaged–despite substantial student eligibility variations among schools reported in previous years. As a result, exceptionally effective high-poverty schools in Cleveland, Akron and Youngstown can no longer be distinguished from schools with relatively advantaged student populations and average or low effectiveness.
Recently (September 2012), the Ohio State Board of Education raised “cut scores” on state reading assessments for third-graders to progress to fourth grade. Beginning this year, under the state’s new “third-grade guarantee,” Ohio schools must assess the reading skills of K-3 students, provide intervention for those reading below grade level, and next year will retain those third-graders who do not meet the benchmark. See here for more information.
Note: For schools whose free/reduced lunch data showed >95% or <5%, these were changed to whole numbers of 95% and 5% for graphing purposes.
Note: Ohio began using a new assessment in 2015. Previous year results should not be compared to the 2016 and subsequent assessment results.
Note: Ohio reports five levels of proficiency, Advanced, Accelerated, Proficient, Basic and Limited. The top three levels of proficiency, Advanced, Accelerated, and Proficient, were used to calculate proficiency for the 2016 and subsequent charts.
 Comparing Ohio’s Proficiency Standards to the National “Gold Standard” (NAEP)
Each state defines for itself what “proficient” means; some states have a rigorous definition, while others are less strict in their standards. To see how states compare, ECF has published charts showing the percentage of students deemed proficient in various subjects and grade levels and compared them to percentages reported for each state by the National Assessment of Educational Progress (NAEP, or “The Nation’s Report Card”), considered to be the gold standard.